|
fy
|
=
|
fx |
|
ny
|
nx |
|
Oscilloscope Lab |
last updated
Sept. 10, 2002
|
The pre-lab and the instructions for the pre-lab are located at http://www2.hawaii.edu/~jmcfatri/labs/scopeprelab.html . The pre-lab is due at the beginning of the class. One pre-lab is due per group.
The objectives of this lab are:
1) to familiarize you with oscilloscope use.
2) to view sine waves, Lissajous figures, and sound on the oscilloscope

|
fy
|
=
|
fx |
|
ny
|
nx |
Part I: Viewing Sine Waves on the Oscilloscope
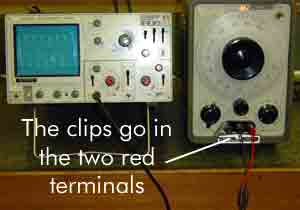
1) Set up the frequency generator and the oscilloscope as shown below:

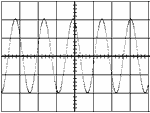
2) You should see a sine wave on the oscilloscope. If you do not see a sine wave, call the TA.3) Adjust the scaling knobs. The VOLTS/DIV knob controls the vertical scale. The TIME/DIV knob controls the horizontal scale. Try to get one oscillation (one wave) to fill most of the screen.
Note: The scaling knobs do not affect the signal in any way. Think of them as "zoom in/ zoom out" controls.
4) Vary the frequency of the generated waves by turning the large knob on the frequency generator. The value of the generated frequency is given by the value on the knob times the value on the multiplier knob.
(Example: The number on the large knob reads "60". The value on the multiplier knob reads 10x. That means the generated frequency is 60 * 10 = 600 Hz.)
a. Change the % output, labeled "amplitude" on the frequency generator to 20.
b. Change the frequency to 30 kHz. (30,000 Hz)
c. Measure the period of the waves by counting the number of horizontal divisions (lines).# of divisions * TIME/DIV = amount of time d. Calculate the frequency of the wave on the screen from the period value you got in part c.
e. Measure the amplitude of the waves by counting the number of vertical divisions:# of divisions * VOLTS/DIV = voltage e. Repeat for f_generator = 15 kHz and 10 kHz5) Set the generator frequency to 30 kHz. Vary the % output on the frequency generator to 10, 30, and 40%. Fill in the data sheet as you did in step 4. (Note: if 40% doesn't fit on your screen, use 15%)
Part II: Sound Waves
The most important thing about this part of the experiment is to have fun!
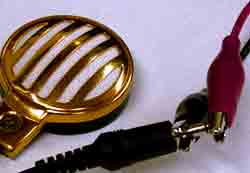
1) Connect the microphone to the oscilloscope as shown below.

2) Whistle into the microphone. (Hey, no spitting!) Try to see if you can get a sine wave.
3) Increase the "loudness" of your whistle. What happens? Describe qualitatively in your data.
4) Change the pitch of your whistle. What happens? Describe qualitatively in your data.Part III: Lissajous Figures
1) Turn the TIME/DIV knob to X-Y EXT HOR, and turn the Source switch to Line (the line frequency = 60 Hz).
2) Try to get the figures given in your data sheet by changing the generator frequency.
3) Read the frequency of the generator by using the oscilloscope (Don't read the dial on the frequency generator.) Do this by switching your oscilloscope back to the original settings from part I.
Part I: Sine WavesPart II: Sound Waves
(*or 15%)
(kHz)
horizontal
setting
( )
( )
( )
vertical
setting
( )
( )
( )
Write your observations below.
|
figure
|
expected
frequency (Hz) |
nx
|
ny
|
measured
frequency ( ) |
|
|
60
|
1
|
1
|
|

|
|
|
|
|

|
|
|
|
|
|
|
|
|
|
|
|
|
|
|
|
1) I have a sine wave input signal with an amplitude of 5 V. If I measure from peak to peak, as in today's lab, how many divisions will I count on the oscilloscope when the volts/division setting is at 5 volts/division?
2) Answer question 1) when the setting is at 1 volt/division. Does changing the setting from 5 volt/division to 1 volt/division alter the input signal or does it alter your view of the signal?
3) What change did you observe in the period of the wave when you changed the pitch of your whistle? (Be specific; a higher pitch does what to the period? a lower pitch?)