|
Oscilloscope Pre-lab Exercise |
last updated
Sept. 10, 2002
|

|
An oscilloscope
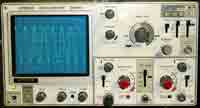
is a device which measures a time-varying voltage. |
(a) The screen:2. Understanding Lissajous Figures:
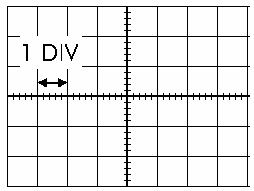
On the screen of the oscilloscope (blue) is a graph of Voltage versus time. The screen is divided into squares called divisions (or DIV for short). Each tick mark in the square is worth 0.2 DIV.
In normal operation, the horizontal axis is time, and the vertical axis is voltage.
(b) Controlling the scale of the graph
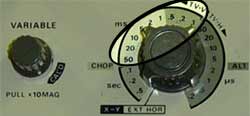
The picture to the left shows the time/div knob. This knob controls the horizontal scale of the graph. The knob is currently turned to 0.1 ms/DIV. (Note that the entire highlighted and circled area is the ms/DIV range.)
Do not turn the knob to the left of the time/div knob; this changes the calibration of the oscilloscope.
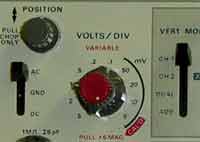
The picture to the left is the volt/div knob. This knob controls the vertical scale of the graph. The knob is currently turned to 1 V/DIV.
The knob to the left of the volt/DIV knob is a position knob, which allows you to move the entire signal up and down.
The switch to the left of the volt.DIV knob reads AC-GND-DC. AC and DC both show voltage signals. The GND or ground switch allows you to see where the 0 V line is on the graph.
Do not turn the red knob on top of the volt/div knob; this changes the calibration of the oscilloscope.
Examples: The pictures below are signals which could appear on the oscilloscope
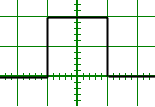
The height and width of the signal are both 2 divisions. We want to know the height and width in volts and seconds, not divisions, so we need the scale factors given by the time/div and volt/div knobs.
The scale factors: the time/DIV knob reads 0.1 ms/DIV and the volt/DIV knob reads 1 V/DIV
The height of the signal is:
2 DIV x 1 V/DIV = 2 VThe width of the signal is:
2 DIV x 0.1 ms/DIV = 0.2 ms

The distance given by the arrow is 4 divisions wide. The height from bottom to top is 4 DIV, but you have measured the 0 V line as the center (heavy horizontal) line. So the signal is 2 DIV above the 0 V line, and 2 DIV below the 0V line.
The scale factors: the time/DIV knob reads 5 ms/DIV and the volt/DIV knob reads 0.5 V/DIV
The height of the signal from bottom to top is:
4 DIV x 0.5 V/DIV = 2 Vbut it is only
2 DIV x 0.5 V/DIV = 1 V above 0 volts (+1 V)The time indicated by the arrow is:
and
2 DIV x 0.5 V/DIV = 1 V below 0 volts (-1 V), so the signal goes from -1 V to +1 V.
4 DIV x 5 ms/DIV = 20 ms
A Lissajous figure is the path that a 2D spring will take. A 2D spring is a spring that can move in the x and y direction (not just up and down). You can also think of a 2D spring as two springs, one which can only move up and down, the other which can only move side to side, but these two springs are attached to the same mass.
If the spring constants of the x and y springs are related by a simple fraction, then sometimes interesting figures occur. This is becuase the spring constants are related to the frequency (w2 = k/m).
Play with the frequencies in the applet by typing in numbers into the two text boxes. To try a new frequency you must press "Go!". The applet should start with the ball moving, with the x-spring frequency set at 2.0 rad/s and the y-spring frequency at 1.0 rad/s.
Important! This applet does not run well under any jre other than 1.3.1. To run the applet you must have a Windows computer or a Mac which has OSX. If you do not have the jre 1.3.1, the applet will try to load it.
If you have Netscape 6.0 or higher, or if you have jre 1.4.0, press the refresh button several times (like 3 to 7) until the ball starts moving. The computers in Wat. 421 are loaded with the 1.4 plug-in, so you need to do this there.
The applet is at: http://www2.hawaii.edu/~jmcfatri/Java/Spring2DTest.html
1. Fill out this table using the applet.
|
figure
|
fx
|
fy
|
|
|
|
|

|
|
|

|
|
|
|
|
|
|
|
|
|
2. If you measured a signal which was 1.5 divisions high and 2.9 divisions wide, what voltage and time does this correspond to if the volt/DIV knob is turned to 0.5 V/DIV and the time/DIV knob is turned to 1 micro-s/DIV?