- Statistics and Uncertainty
- The best estimate of the quantity is the average or mean value. The average of a series of measurements is the sum of the values, x, divided by the number of measurements taken, N.
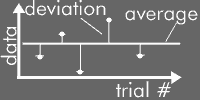
The uncertainty in the value should obviously have something
to do with how far a data point deviated from this average value.
First, let me define the word deviation. The deviation is the difference between an individual measurement and the average of such measurements.
First, let me define the word deviation. The deviation is the difference between an individual measurement and the average of such measurements.

The common sense idea of error suggests that the amount of deviation
from the average line should be the reported error. Since each
value has a different deviation, perhaps we should report the average
of the deviations.
Example: Measuring a pen|
Length (cm)
|
Deviation from average (cm)
|
|
18.1
|
-0.1
|
|
18.2
|
0.0
|
|
18.1
|
-0.1
|
|
18.4
|
+0.2
|
|
18.0
|
-0.2
|
|
average:18.2
|
average deviation : 0.0 (!!)
|
The average deviation turns out to be zero! For random errors,
the average deviation approaches zero as more measurements are done.
This is a re-statement of what I said earlier -- that we are just as
likely to overestimate a value as underestimate it.
So what should we do? Well, the problem we had when we found the average deviation was that the positive values canceled out the negative values. If we could make all the deviations positive, then we wouldn't get a zero average. There is an easy way to do this: square each deviation ! Then we can take the average and square root to get the uncertainty.
So what should we do? Well, the problem we had when we found the average deviation was that the positive values canceled out the negative values. If we could make all the deviations positive, then we wouldn't get a zero average. There is an easy way to do this: square each deviation ! Then we can take the average and square root to get the uncertainty.
|
Length (cm)
|
Deviation from average (cm)
|
Square Deviation (cm^2)
|
|
18.1
|
-0.1
|
0.01
|
|
18.2
|
0.0
|
0.00
|
|
18.1
|
-0.1
|
0.01
|
|
18.4
|
+0.2
|
0.04
|
|
18.0
|
-0.2
|
0.04
|
|
average:18.2
|
average deviation : 0.0
|
average square deviation: 0.02
|
|
root of average square deviation: 0.1 cm
(This is the standard deviation!) |
The "root of the average square deviation" is a bit of a mouthful, so we have another name for this quantity: the standard deviation.
- The
standard deviation is the uncertainty in the value.
The reason for the N - 1 is simple. If you have only one measurement (N = 1), what should the statistical uncertainty be? If you used the first equation, you would get zero. But that is a silly statement. The uncertainty in a single measurement is not zero.
The standard deviation, then, is the uncertainty you would report on all of your data values. You should write in your report:
|
Length (cm)
|
|
18.1 +/- 0.1
|
|
18.2 +/- 0.1
|
|
18.1 +/- 0.1
|
|
18.4 +/- 0.1
|
|
18.0 +/- 0.1
|
|
average:18.2 +/- ???
|
But what about the uncertainty in the average? We'd like to report that too.
If you think about it a little, you can see that the uncertainty in our average value should be related to the number of data points we have. If we only measured the value two times, we expect that our average value would not be as good as if we measured the value two hundred times.
To solve this problem we find the standard deviation of the mean (SDM). The standard deviation of the mean is the standard deviation of the values devided by the square root of the number of values. (Why? See Chapter 4 in the 151/170 lab manual, our third experiment).
If we do this, we have found the uncertainty in the average. This is our reported value:
18.16 +/- (0.1/sqrt(5)) cm = 18.16 +/- 0.04 cm
The best estimate is the average or mean value:

The definition of the standard deviation:

An alternate definition of the standard deviation. This is the uncertainty in a single data value.
The standard deviation of the mean is the uncertainty in your reported (average) value:

You should report values as:

Report single data values as:
Report average values as:

