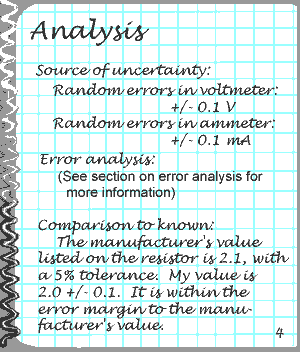
Your analysis should consist of three parts:
Example:
- source of uncertainty: identify the values which have uncertainty. How much uncertainty does each measurement have?
- error analysis: determine how the uncertainties affected your data. What did you calculate from the values listed in the previous section?
- comparison to the known value(s): what does the theory predict? Does your value match the theory within propagated uncertainties? If not, explain.
You read the value of the voltage and current from the multimeter. You note that the smallest unit on the display is 0.1 V, so you assume that the manufacturer of the multimeter has calibrated the display to only hold the number of significant figures to which it is accurate. You write down: "random errors in voltmeter reading: +/- 0.1V".
Similarly, you should write down the uncertainty of every variable in the experiment which you have read directly (i.e. have not calculated to obtain).
error analysis: you either need to obtain a statistical error of your calculated values, or a propagated error. A complete explanation of errors and error analysis is too long to be listed here. There are entire books written on the subject! I have written a summary of the kind of analysis I expect in your report. Go to the error analysis section->
