Try to answer the questions before looking at the answers. The answers are at the bottom of the page.
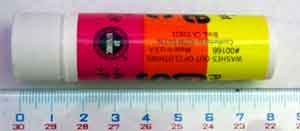
1. How much uncertainty would you give to a measurement of the length of the glue bottle in the picture below?

2. Is the uncertainty in measuring a pencil random or systematic?


3. You measure the time of an event repeatedly. Fill in this chart.
(So you should find the error in all your measurements, the average,
and the error in the average).
4. You want to add three numbers with error. What is the error in the sum?
|
Time
(s) |
error
|
|
1.03
|
|
|
1.01
|
|
|
1.02
|
|
|
0.99
|
|
|
0.97
|
|
|
ave = |
4. You want to add three numbers with error. What is the error in the sum?
z = a + b + c
a = 5.00 cm
a = 0.01 cm
b= 3.51 cm
b = 0.02 cm
c = 15.95 cm
c = 0.05 cm
Answers
1. The uncertainty you ascribe to a single data value (without repeating the measurement) is up to you. You are telling me how closely YOU can measure something. However, a reasonable value would be 2-3 mm, since it is difficult to determine where exactly the end of this rounded object is.
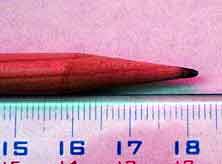
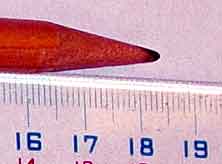
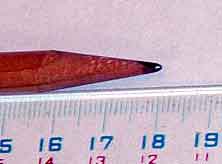
2. Both! You can have both random and systematic error in this measurement. One source of this uncertainty is parallax. Parallax can be random or systematic. What is parallax? Parallax is the difference in length you observe when you look at an object from different angles. See the pictures below. Do the lengths look different? The only thing that has changed is the camara angle!

|

|

|
If you had measured the pencil with your head always to one side,
that would be a systematic error, because you would always see the length
of the pencil longer or shorter than it acutally was depending on which
side your head was on. If you had constantly been moving your head around
randomly to one side or the other as you measured, that would be a random
error. It is often difficult to determine whether you are looking at something
"dead on" so this is something that almost always occurs.
3. The error in repeated measurements is given by the standard deviation.
The error in the average is given by the standard deviation of
the mean.
4. The error in the sum is given by the propagation formula:
|
Time
(s) |
error
|
|
1.03
|
+/-0.02
|
|
1.01
|
+/-0.02
|
|
1.02
|
+/-0.02
|
|
0.99
|
+/-0.02
|
|
0.97
|
+/-0.02
|
|
ave = 1.00
|
+/-0.01
|
4. The error in the sum is given by the propagation formula:
z = square root(
a2 +
b2 +
c2)
= square root( (0.01 cm)2 + (0.02 cm)2 + (0.05 cm)2 )
= 0.05 cm