N otes on Chapter 9B
pp 96 - 103 of your lab book
We have discussed a simple spring system previously in the natural oscillations lab. We have even shown that this simple spring model can work for other physical objects such as compressions in a jar of air. Now it's time to "kick it up a notch"! In real life, the simple spring oscillating at its natural frequency almost never happens. Why? Because we are almost always going to have a damping force such as friction working on a real system.
Such oscillations, where you have only the spring force and the damping force, are called damped oscillations.
The frequency at which these oscillations vibrate at is not equal to the natural frequency, but if the damping force is small, then the frequency is nearly the natural frequency. We have depended on this fact for all of the labs in which we obtained the natural frequency (pendulum, natural oscillations, spring of air). In this lab, we will not make the damping force small. We want to see damping occur, so we will place part of our apparatus in water.
Our goal in this lab is not to observe damped oscillations, however. Our goal is to observe driven and damped oscillations! Another words, we are interested in a spring system which has a large damping force (provided by the water) and has a driving force. A driving force is provided by a motor which can drive the entire system at varying frequencies.
What will you see when you let this entire system start oscillating? The spring will still have a sine wave oscillation. The frequency it oscillates at will be the frequency you are driving it at (the driving frequency). That sounds just like what we saw in the natural oscillations lab except that the frequency is different. But wait! There is one important difference! When you change the driving frequency the amplitude of the oscillations changes! Without changing the driving amplitude, the amplitude of the spring oscillations increases or decreases as you change the driving frequency. You will find that there is a frequency at which the amplitude is maximum.
Apparently there are some driving frequencies which yield a large amplitude response. This is called resonance. The frequencies where you observe the maximum responses are called resonant frequencies. This is a very important concept in applied physics. This concept is used to make radio tuners. Resonance was to blame for the amazing Tacoma Narrows bridge collapse. It's a fancy word, but you will find that you already understand resonance in every day life.
Example: Pushing a child on a swing (a pendulum).
Class Participation: What frequency should you push (drive) the swing at?
What happens to the swing if you push it at some other frequency?
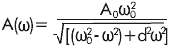
We can make a plot of the amplitude versus the driving frequency. This plot is so important, it has a name: it is called the response curve. Theoretically, this curve is given by the equation:
pp 96 - 103 of your lab book
We have discussed a simple spring system previously in the natural oscillations lab. We have even shown that this simple spring model can work for other physical objects such as compressions in a jar of air. Now it's time to "kick it up a notch"! In real life, the simple spring oscillating at its natural frequency almost never happens. Why? Because we are almost always going to have a damping force such as friction working on a real system.
Such oscillations, where you have only the spring force and the damping force, are called damped oscillations.
The frequency at which these oscillations vibrate at is not equal to the natural frequency, but if the damping force is small, then the frequency is nearly the natural frequency. We have depended on this fact for all of the labs in which we obtained the natural frequency (pendulum, natural oscillations, spring of air). In this lab, we will not make the damping force small. We want to see damping occur, so we will place part of our apparatus in water.
Our goal in this lab is not to observe damped oscillations, however. Our goal is to observe driven and damped oscillations! Another words, we are interested in a spring system which has a large damping force (provided by the water) and has a driving force. A driving force is provided by a motor which can drive the entire system at varying frequencies.
What will you see when you let this entire system start oscillating? The spring will still have a sine wave oscillation. The frequency it oscillates at will be the frequency you are driving it at (the driving frequency). That sounds just like what we saw in the natural oscillations lab except that the frequency is different. But wait! There is one important difference! When you change the driving frequency the amplitude of the oscillations changes! Without changing the driving amplitude, the amplitude of the spring oscillations increases or decreases as you change the driving frequency. You will find that there is a frequency at which the amplitude is maximum.
Apparently there are some driving frequencies which yield a large amplitude response. This is called resonance. The frequencies where you observe the maximum responses are called resonant frequencies. This is a very important concept in applied physics. This concept is used to make radio tuners. Resonance was to blame for the amazing Tacoma Narrows bridge collapse. It's a fancy word, but you will find that you already understand resonance in every day life.
Example: Pushing a child on a swing (a pendulum).
Class Participation: What frequency should you push (drive) the swing at?
What happens to the swing if you push it at some other frequency?
We can make a plot of the amplitude versus the driving frequency. This plot is so important, it has a name: it is called the response curve. Theoretically, this curve is given by the equation:
where  0 is the natural frequency, A0 is the driving
amplitude, d is a damping term, and
is the driving frequency.
0 is the natural frequency, A0 is the driving
amplitude, d is a damping term, and
is the driving frequency.